This nugget is based on the paper by
Sharma, R., Battaglia, M., Luo, Y., Chen, B., Yu, S., 2020 ApJ 904 94
Introduction
In a solar flare, the plasma is locally heated and particles are accelerated to energies from a few tens of keV to MeVs. X-ray bremsstrahlung emission and radio gyrosynchrotron emission are highly complementary and provide diagnostics of the timing, location and spectral properties of flare-accelerated electrons in a broad energy range.
Here we present comprehensive observations of multiple individual bursts during a GOES B1.7-class
(back-ground subtracted) microflare observed jointly in radio by the VLA, in X-rays by RHESSI,
and in the ExtremeUltraviolet (EUV) by the Atmospheric Imaging Assembly (AIA; Lemen et al. 2012)
on board the Solar Dynamics Observatory (SDO; Pesnell et al. 2012).
The observations are indicative of multiple co-temporal acceleration episodes during the impulsive
phase of a solar microflare. The X-ray and radio burst sources likely originate from separate electron
distributions in different magnetic loops.
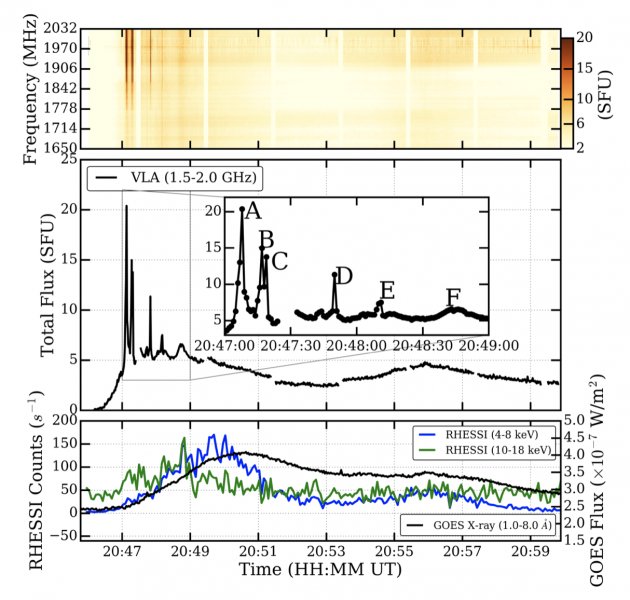
Figure 1 – Temporal evolution of radio and X-ray emission during the B1.7-class flare on 2012 February 25 (SOL2012-02-25T20:50:34). Top: VLA dynamic spectrum showing the total flux computed from the radio images for each frequency-time pixel in the observation. Each pixel has a size of 4 MHz and 1 s in frequency and time respectively. The second panel shows the frequency averaged VLA spectrum from 1.65 GHz to 2.03 GHz. The inset shows 5 distinct radio bursts marked by letters. The third panel shows X-ray light curves from RHESSI and GOES.
Spatial-temporal Evolution of Radio and X-ray Sources
The radio lightcurves show six distinct short-lived radio bursts (labeled A, B, C, D, E, and F in Figure 1)
associated with increased X-ray emission. The flare shows distinct spatial-temporal features at EUV, X-rays
and radio wavelengths. The EUV 193 Å images show two separate ribbons (Figure 2A). The radio emission shows six
distinct short-lived radio bursts (labeled A, B, C, D, E, and F in Figure 1). During the radio bursts, the observed
compact clustering suggests a bright common radio source for all shown radio frequencies (Figure 2B).
Both X-ray sources and radio bursts A, B and C appear near the northern ribbon, but they are not co-spatial
with each other. The location of these burst sources projected onto the flare ribbon suggests a low coronal
origin of the emission. Using a magnetic extrapolation model, the altitude of the radio sources is inferred
to be ~2700 km.
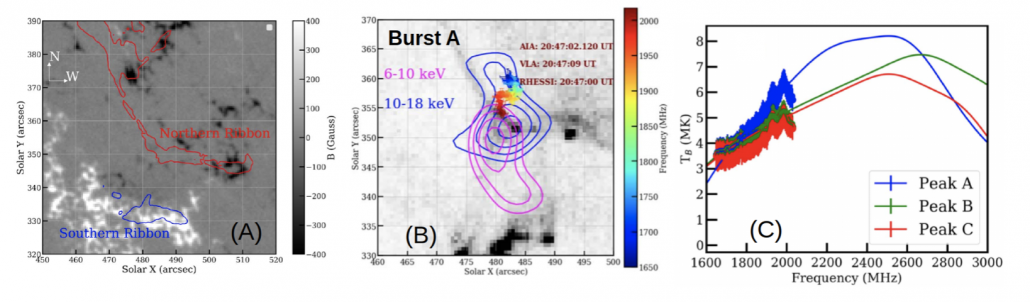 Figure 2 – Panel (A): HMI magnetogram at 20:51:45 UT. The red and blue contours are emission observed
by AIA 304 Å at 20:51:32 UT for northern and southern ribbons, respectively. The contour level shown is at
18% of the maximum brightness. Panel (B): Evolution of the AIA 94 Å EUV ribbons (black and white image, color
table inverted), X-ray RHESSI sources (magenta and blue contours), and VLA radio centroid (crosses) positions.
The RHESSI contour levels are at 65%, 75%, 85%, and 95% w.r.t map’s peak. Panel (C): The spectra of the brightness
temperature for the three fitted, individual bursts (labeled A, B, and C) are shown in blue, green and red respectively. The solid lines shows the optimum MCMC fit represented in their colors.
Figure 2 – Panel (A): HMI magnetogram at 20:51:45 UT. The red and blue contours are emission observed
by AIA 304 Å at 20:51:32 UT for northern and southern ribbons, respectively. The contour level shown is at
18% of the maximum brightness. Panel (B): Evolution of the AIA 94 Å EUV ribbons (black and white image, color
table inverted), X-ray RHESSI sources (magenta and blue contours), and VLA radio centroid (crosses) positions.
The RHESSI contour levels are at 65%, 75%, 85%, and 95% w.r.t map’s peak. Panel (C): The spectra of the brightness
temperature for the three fitted, individual bursts (labeled A, B, and C) are shown in blue, green and red respectively. The solid lines shows the optimum MCMC fit represented in their colors.
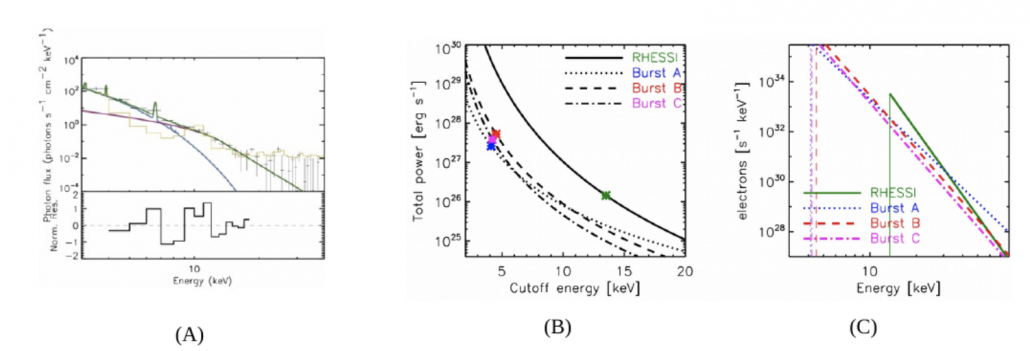 Figure 3 – Left: RHESSI spectrum along with the fitted thermal and nonthermal components between 20:47:00 UT and
20:47:28 UT. The black crosses show the RHESSI spectrum, while the green curve shows the sum of the thermal (blue line)
and nonthermal (purple line) components. The yellow histogram shows the background spectrum. Middle: nonthermal power
as a function of low-energy cutoff for the spectral parameters inferred from the X-ray fit (RHESSI) and from the
gyrosynchrotron fits of bursts A to C. The symbols mark the nonthermal power calculated from the observed low-energy
cutoff. Right: model electron spectra inferred from X-rays (RHESSI) and radio bursts A to C. The vertical lines give the
position of the low-energy cutoff.
Figure 3 – Left: RHESSI spectrum along with the fitted thermal and nonthermal components between 20:47:00 UT and
20:47:28 UT. The black crosses show the RHESSI spectrum, while the green curve shows the sum of the thermal (blue line)
and nonthermal (purple line) components. The yellow histogram shows the background spectrum. Middle: nonthermal power
as a function of low-energy cutoff for the spectral parameters inferred from the X-ray fit (RHESSI) and from the
gyrosynchrotron fits of bursts A to C. The symbols mark the nonthermal power calculated from the observed low-energy
cutoff. Right: model electron spectra inferred from X-rays (RHESSI) and radio bursts A to C. The vertical lines give the
position of the low-energy cutoff.